The Volokh Conspiracy
Mostly law professors | Sometimes contrarian | Often libertarian | Always independent
The YIMBY Napkin
Checking the credibility of Hsieh-Moretti the lazy way. Third in a series of guest-blogging posts.
In 2019, Chang-Tai Hsieh and Enrico Moretti published "Housing Constraints and Spatial Misallocation" in the American Economic Journal. It's probably academia's most famous Yes In My Backyard (YIMBY) article. H-M imagined a scenario where New York City and the Bay Area never imposed draconian housing regulation. Then they estimated how much bigger the U.S. economy would have been in this alternate history. Their answer was shocking. Restraining local regulation in just two keys localities would have made total U.S. GDP 4-9% higher.
The key idea: New York City and the Bay Area are the country's most productive areas. Given the same inputs, they yield an exceptionally large quantity of output. In economic jargon, they have sky-high Total Factor Productivity. With much less housing regulation, housing prices in these TFP-rich areas would be much lower. Their populations would, in turn, be much higher. Production would naturally fall in low-TFP regions, but rise far more in high-TFP regions. As a result, the total output of the country would rise.
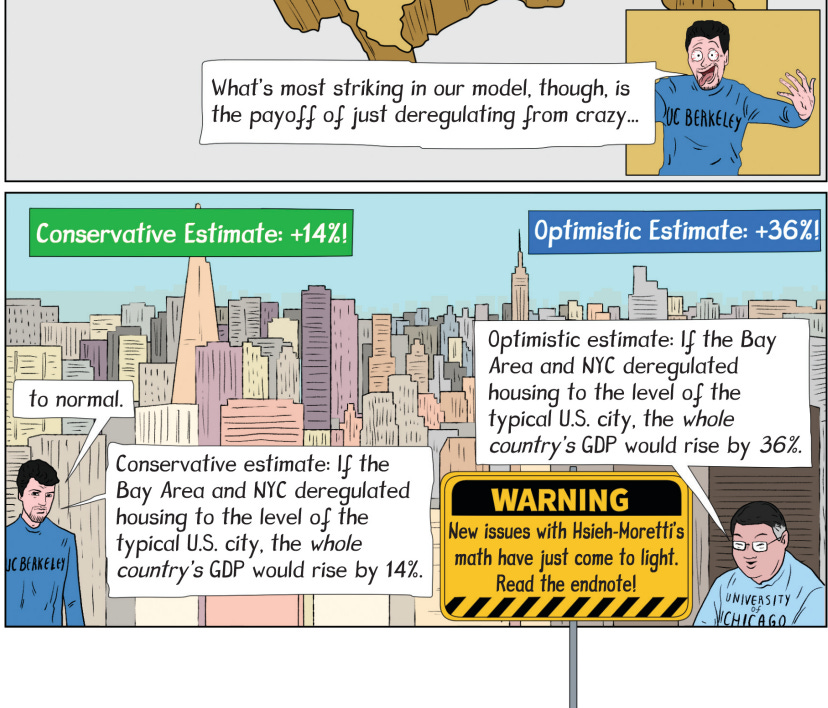
When writing Build, Baby, Build, I reviewed H-M closely. To my surprise, I discovered multiple arithmetic errors, which Hsieh and Moretti quickly acknowledged. Strangely, my corrections actually strengthened their results. Instead of implying that GDP would be 4-9% higher, their paper actually implies that GDP would be 14-36% higher. Super shocking!
Not long before my book went to print, however, economist Brian Greaney published a much more fundamental critique of H-M. This time, however, Hsieh and Moretti did not concede. Nor did Greaney. Given my time constraints, I decided to just insert a warning into the text and add a detailed endnote on the controversy. Like so:

Recently, however, I started wondering what a quick "back-of-the-envelope" or "napkin" calculation would reveal. When I teach the economic effects of immigration, for example, I normally start by multiplying rough estimates of (a) gains per immigrant by (b) total number of immigrants. In principle, one could do the same for domestic migration. Why not give it a try?
After looking for easily accessible data and weighing a few different approaches, I did the following.
- I found data on mean earnings by education by state (plus Washington, DC) in Table A6 of John Winters' "What You Make Depends on Where You Live: College Earnings Across State and Metropolitan Areas."
- To make life easier, I only did calculations for the "High School" and "Bachelor's Degree" calculations, and assumed that 2/3rds of workers were in the former category, and 1/3rd in the latter. Close enough.
- I coded the following as having "Bad Zoning": California, Connecticut, DC, Massachusetts, Maryland, New Jersey, New York, and Rhode Island.
- I calculated population-weighted average mean earnings in Bad Zoning states, and assumed that post-deregulation migration into the Bad Zoning states would be proportional to their existing populations.
- I assumed that if Bad Zoning were ended, the fraction of workers who would move was directly proportion to the percentage wage gain for their educational category.
- I set an elasticity of .2, which implies that a 5% wage gain would induce 1% of workers to move.
- Snapping these pieces together, I calculated per-worker annual dollar gains for both educational categories for all states. If a mover gains $5000, but only 2% of workers would actually move, the per-worker gain is $100.
- I can use population weights to calculate per-worker gains for the whole country. If, for example, there were two states total, one with 1M people and the other with $99M, the per-worker gains for the country would be 1% times the gain in the first state plus 99% times the gain in the second state.

Since this was too much to actually write on a napkin, I set it all up as a simple Google Sheet, which you can view (and tinker with!) here. Obviously you can lodge dozens of complaints about what I did, but I'm just going for basic plausibility.
Here's what I found: Under my assumptions, GDP rises by $532 per worker, about +.8%. Much lower than H-M's original lower bound of +4%. A lot in absolute terms, but nothing transformative.
How sensitive are the results to the assumptions?
- The gains are directly proportional to the elasticity of .2 that I set in Assumption #6. If you think that a 1% wage gain will prompt 1% of workers to move, H-M's initial lower bound is correct. But that seems crazy high.
- I used state-level data because it was easier. But Table 11 in "What You Make Depends on Where You Live" has data on income by education for 104 metropolitan areas (MSAs). The poorest metropolitan areas are almost as poor as the poorest states, but the richest metropolitan areas are markedly richer than the richest states. The non-metropolitan areas would generally be poorer still.
- Upshot: A thought experiment where housing deregulation causes movement to the very richest metropolitan areas (rather than just the richest states) could plausibly yield gains twice as large as my initial estimates. If you want to do the actual work, I'll gladly run it as a guest post on my Substack.
Why are estimates of the domestic migration gains so much smaller than estimates of international migration gains?
First, because gains per capita are so much larger internationally. As Clemens, Montenegro, and Pritchett (CMP) show, immigrants from the Third World to the U.S. routinely multiply their income by a factor of 5 or 10. In contrast, moving from the very poorest MSA (El Paso, Texas) to the very richest (Bridgeport-Stamford-Norwalk, Connecticut) multiplies high school earnings by 1.6 and college earnings by 2.7. The biggest intra-national gains are about as big as the smallest international gains in CMP.
Second, because far more people want to migrate internationally. Massive gains motivate billions. Moderate gains motivate only millions, or perhaps tens of millions. Big times big is massive, but moderate times moderate remains moderate.
The lesson: Hsieh and Moretti's initial estimates were always implausibly large. When I corrected their math, yielding even bigger estimated effects, I should have taken out a napkin for a quick plausibility check.
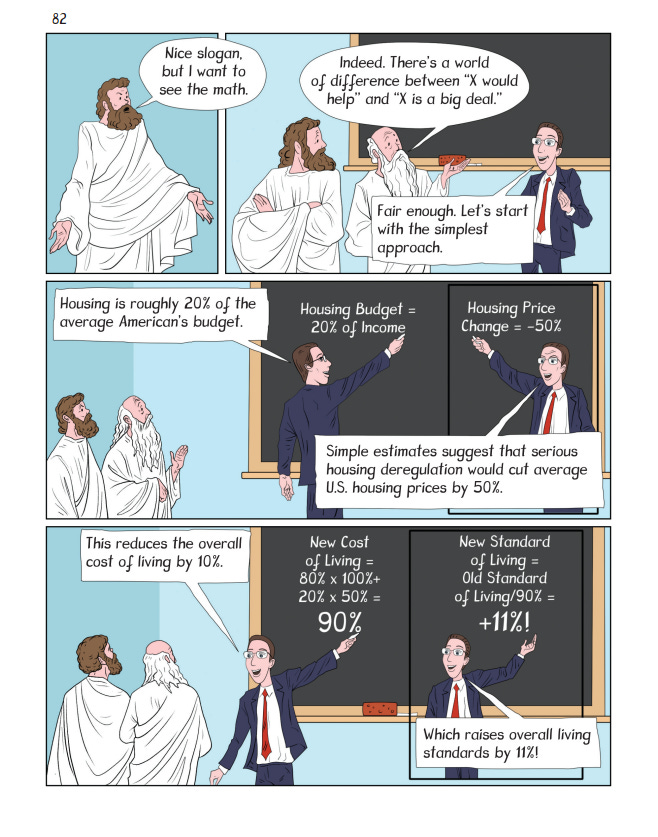
Fortunately, I have another napkin. A better napkin. The cleanest, clearest case for YIMBY is simply that (a) housing deregulation would sharply reduce housing prices (by about 50%), and (b) housing is a large share of the household budget (about 20%). So deregulation would ultimately cut the cost of living by 10% — and raise living standards by 11%. (Read the book for details).
I'll never get in the American Economic Journal with this argument, but I say it's solid.

To get the Volokh Conspiracy Daily e-mail, please sign up here.


Show Comments (31)